Claude usage on the Mac desktop: your 5-hour window and weekly limit as a widget
Last updated: 2026-08-24
Your claude.ai account reports how much of its 5-hour window and its weekly limit you have used, on a usage page you open in a browser when you think to look. Emerald Tools is a menu bar app for macOS 14.0 or later with an optional Claude usage widget that keeps those same figures in the corner of your desktop, reading them from your own signed-in claude.ai session at most once a minute and showing them on your Mac and nowhere else. Emerald Tools is an independent app: it displays the numbers your account reports, and it neither sets those limits nor changes them.
Reading the figures in a browser
- The numbers live on your account's usage page at claude.ai, which you open in a browser when you want to see them.
- Looking means leaving whatever you were doing — which, during a long session, is exactly the interruption you were trying to avoid.
- What you get is the figure at the moment you looked. Between visits nothing on your Mac tells you where you stand.
The Claude usage widget in Emerald Tools
- Puts the 5-hour figure, the time left until it resets and a bar in a corner of the desktop, in a strip 210 by 64 points.
- Expands on a click to show the 5-hour window and the weekly figure together.
- Shows the whole picture — 5-hour, weekly, and any per-model limits your account reports — on its own page inside the app.
- Reads your own signed-in claude.ai session at most once a minute, only while a usage screen or widget is open, and displays the result locally.
How to show your claude.ai usage on the Mac desktop
- Open the Claude pageInstall Emerald Tools from the Mac App Store and click its icon in the menu bar. Choose Open Dashboard... — or press ⌘D while the menu is open — and pick Claude in the sidebar, under the Services heading. Google Drive sits beside it under the same heading; both are connections to a service you sign in to, rather than settings.
- Sign in to claude.aiThe page explains what will be read and offers a Connect button, which opens claude.ai's own sign-in page inside a sheet. Sign in with your email address: claude.ai sends a verification code, and you type it into the same sheet. Continue with Google does not work here — Google refuses OAuth inside an embedded web view, which is why the sheet says so above the page. The sheet closes itself once the session is established.
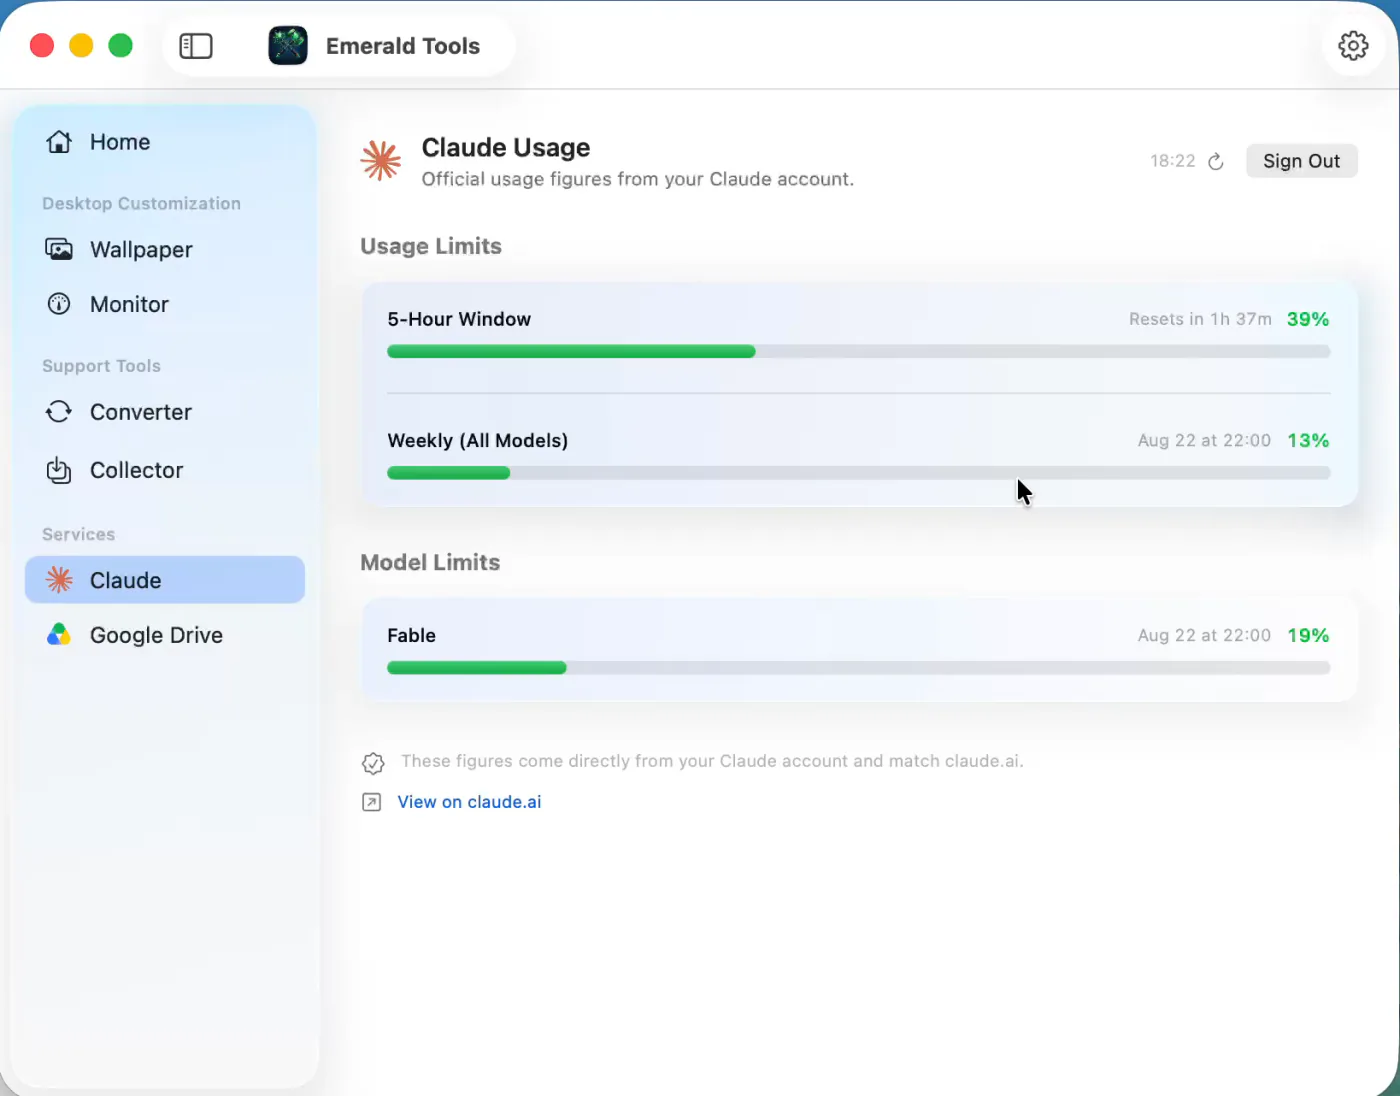
- Read the figuresUsage Limits shows the 5-Hour Window with the time until it resets, and Weekly (All Models) with its own reset. Model Limits appears underneath when your account reports limits scoped to a particular model, one row each. The time beside the header is when the figures were last fetched, the circular arrow fetches them again immediately, and View on claude.ai opens the same figures on the site.
- Put the widget on the desktopPick Monitor in the sidebar, under Desktop Customization, choose the display you want, and click the plus in one of the four corners of the Widget Placement diagram. Claude Usage is the last entry in the list of widget types, after the nine system metrics. It appears in that corner straight away, and it obeys the same placement rules as the other widgets: three per corner, sixteen points in from the edge, above ordinary windows and present on every Space.
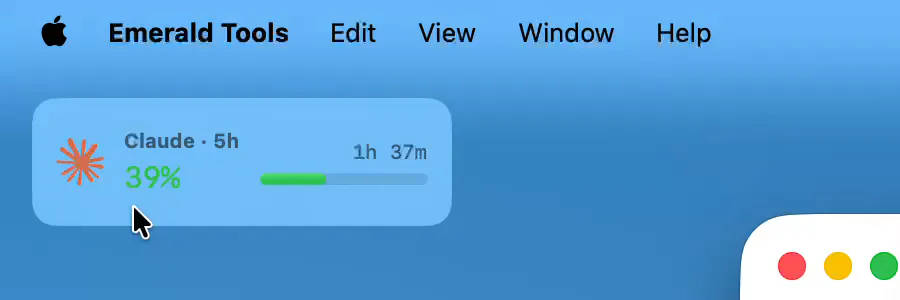
- Click the widget to expand itCompact, the widget is one strip: the 5-hour figure, the time until it resets and a bar. Click it and it expands in place to 280 by 120 points, with the 5h Window and Weekly figures on separate rows, each with its own reset time and bar. Click it again to collapse it. The click is taken by the widget alone and never brings Emerald Tools to the front.
- Adjust it, or disconnectThe chevron beside the widget in Active Widgets opens its own page, where its size can be scaled between 50% and 200% and its background made anywhere from opaque to fully transparent. To disconnect, go back to the Claude page and use Sign Out: the isolated cookie store this feature keeps is erased, the figures disappear, and the widget falls back to reading Not Connected.
What the widget reads, and what it does not
The feature is deliberately narrow, and it is worth being precise about its edges before anything else.
- It reads utilisation, not content. One request goes to the usage endpoint of your organisation on claude.ai, and what comes back is a set of percentages and reset timestamps: the 5-hour window, the seven-day window, and any limits scoped to a particular model. That is the whole of it.
- It signs in as you, in a browser the app hosts. There is no key to paste and no token to manage. The sign-in page is claude.ai’s own, shown inside a sheet, and what persists afterwards is an ordinary session cookie.
- That session is kept apart. It lives in a data store this feature owns, separate from the one the media Collector uses and from Safari’s, and Sign Out deletes the store rather than tidying it.
- Nothing is uploaded. The figures are displayed on your Mac. There is no account with Emerald Tools, no server the developer runs for this, and no copy of the numbers anywhere else.
- It changes nothing about your account. The limits are your account’s; the widget reports where you are inside them.
Two places the figures appear
The Claude page in the dashboard is the full view. Usage Limits carries the 5-Hour Window and Weekly (All Models) rows, each with a bar, a percentage and when it resets — a time of day when the reset is less than a day away, a date and time when it is further out. Model Limits appears below it only when your account reports limits scoped to a model, and lists them one row per model. Underneath sit two notes: that the figures come from your account and match claude.ai, and a link that opens the usage page on the site.
The widget is the glanceable view. In its compact form it shows the 5-hour figure, because that is the one that changes while you work, with the time until it resets and a bar. Expanded, it adds the weekly figure on its own row. It is one of ten widget types in the app; the other nine measure the machine — CPU, memory, swap, disk, storage I/O, network, battery, GPU and thermal state — and are covered in a guide of their own on the system monitor widgets. Placement, stacking and the click-to-expand behaviour work identically for all ten.
Signing in, and staying signed in
The sign-in sheet hosts claude.ai’s own login page. Two things about it are worth knowing before you start.
Use your email address, not Google. Google refuses to complete an OAuth sign-in inside an embedded web view. The attempt does not hang; it comes back as an error from claude.ai, which is confusing if you were not expecting it. The email route works: claude.ai sends a verification code, you type it into the same sheet, and the sheet closes itself once the session is ready.
Sessions end, and the app distinguishes two reasons. If claude.ai reports that the session is no longer valid, the app discards the stored session — the whole store, not only the session cookie, because leftovers from a dead session are what make the next sign-in fail — and asks you to connect again. If instead the request is turned away by the network in front of claude.ai, which can happen while a VPN moves your exit point around, the session is kept and the app waits longer before its next attempt. The distinction matters: treating a passing block as an expiry would sign you out for no reason.
What is stored, and what is not
The app records a year of system metrics, so it is worth saying which part of that applies here.
The system figures — CPU, memory, disk, GPU, battery, network, storage I/O and swap — are measured on your own Mac at an interval you choose and written to a local store: minute averages for a day, hour averages for a month, day averages for a year. The claude.ai usage figures are not part of that store in the current release. What the app holds is the latest snapshot, in memory, replaced by the next fetch and gone when the app quits, and those figures are not among the metrics the Metrics History panel can chart. For a record over time, the usage page on claude.ai is the place to look.
Specifications and limits
Everything below is the behaviour of the current release, not a plan.
- Figures shown: utilisation of the 5-hour window, utilisation of the weekly limit, and any per-model limits your account reports, each with its reset time.
- Source: a single request to the usage endpoint of your organisation on claude.ai, made through your own signed-in session.
- Refresh interval: at most once a minute, only while the Claude page or a widget is open; a manual refresh is always available.
- Rate limiting: Retry-After is honoured when sent; otherwise the wait doubles from one minute, capped at an hour.
- Sign-in: claude.ai’s own page, hosted in a sheet. Email sign-in works; Google’s OAuth is blocked by Google inside embedded web views.
- Session storage: a data store used by this feature alone, erased in full on Sign Out.
- Transmission: to claude.ai only, and only as a result of your own actions. No account with Emerald Tools, no analytics, no server.
- History: not kept in the current release. The figures are held in memory only, and are not among the eight metrics the app charts.
- Widget size: 210 by 64 points compact, 280 by 120 expanded.
- Widget placement: any corner of any display, three per corner, sixteen points in from the edge, above ordinary windows and on every Space.
- Per-widget adjustment: scale from 50% to 200% and background opacity from 0% to 100%. The alert threshold applies to the CPU and memory widgets only.
- Colour thresholds: green below 70%, orange from 70%, red from 90%.
- Permissions: none beyond signing in to claude.ai. No screen recording, no accessibility, no notifications required for this feature.
- System requirement: macOS 14.0 (Sonoma) or later.
Emerald Tools is an independent app. It is not affiliated with, endorsed by or sponsored by Anthropic, and it is not a way to use Claude — it reads the usage figures of the account you sign in to, and shows them to you on your own Mac.
Frequently asked questions
Where do the numbers come from?
From your own claude.ai account. Once you have signed in, the app makes a single request to the usage endpoint of your organisation on claude.ai — the same source that fills in the usage page on the site — and reads three things out of the answer: how much of the 5-hour window is used, how much of the weekly limit is used, and any limits scoped to a specific model. Nothing else is requested, and the figures match what claude.ai shows you.
Can Emerald Tools read my conversations?
The feature makes one kind of request, to the usage endpoint, and reads utilisation percentages and reset times out of the reply. Your prompts and replies are not part of that answer. The signed-in session lives in a data store used by this feature alone, kept apart from the store the media Collector uses, and signing out deletes it in full.
How often is the usage refreshed?
At most once a minute, and only while a usage surface is open — the Claude page, a placed widget, or both. Close them all and the polling stops. The circular arrow on the Claude page fetches immediately when you ask it to. If claude.ai rate-limits the request, the app waits: it honours the Retry-After header when one is sent, and otherwise backs off from a minute upwards, to an hour at most.
Does the widget keep a history of my usage?
Not in the current release. The figure is fetched, displayed and replaced by the next fetch; it is held in memory rather than written to disk. The Metrics History panel charts eight metrics — CPU, memory, disk, GPU, battery, network, storage I/O and swap, all measured by the app on your own Mac — and the claude.ai figures are not among them. For a record over time, the usage page on claude.ai is the place to look.
Why does "Continue with Google" fail when I sign in?
Google declines to run its OAuth sign-in inside an embedded web view, which is what the sign-in sheet is, so the attempt ends in an error from claude.ai rather than a signed-in session. Sign in with your email address instead: claude.ai sends a verification code, you type it into the same sheet, and the session is established the same way. The sheet says as much above the page, for exactly this reason.
What happens when the session expires?
The app notices on its next fetch, clears the stored session and shows the Connect button again; the widget falls back to Not Connected. Signing in again restores it. A temporary block from the network in front of claude.ai — the kind a VPN whose exit keeps moving can provoke — is treated differently on purpose: the session is kept and the app simply waits longer before trying again, so a passing block does not cost you a sign-in.
Is this an official product of the company behind Claude?
No. Emerald Tools is an independent app and is not affiliated with, endorsed by or sponsored by Anthropic. It signs in to claude.ai as you, with your own credentials, and displays the usage figures your account reports. It does not grant, extend or alter any limit, and it is not a way to use Claude itself.
What do the colours mean?
The same three everywhere the figure appears: green below 70%, orange from 70% to 89%, red at 90% and above. The bar fills in proportion to the percentage, so a glance at the corner of the screen answers "how much is left" without reading the number.
Can I put the widget on more than one display?
Yes, on any display and in any of its four corners, alongside the system monitor widgets — up to three per corner. Placements belong to a display and are remembered by display identity, so disconnecting a monitor and plugging it back in returns the widget to the corner you chose. Placing a widget also starts the system metrics collection that the other widgets use.
What do I need to run Emerald Tools?
A Mac running macOS 14.0 (Sonoma) or later, and a claude.ai account to sign in to for this particular feature. Emerald Tools is a subscription app with a 14-day free trial, and the App Store listing shows the current terms for your region. The Claude usage widget is optional: the other four tools in the app work without it and need no account at all.
Get Emerald Tools for macOS
The Claude usage widget is one part of Emerald Tools, alongside multi-display live wallpapers, system monitor widgets, screenshots that upload to Google Drive, a web media collector, and a WebP to MP4 converter. It lives in the menu bar and stays out of your Dock.