Mac system monitor widgets: CPU, GPU, memory and network on your desktop
Last updated: 2026-08-24
macOS reports CPU, memory, disk and network in Activity Monitor, which is an application window you open, read and close again, and it keeps no record of what the machine was doing an hour ago. Emerald Tools is a menu bar app for macOS 14.0 or later that puts nine of those readouts in the corners of your desktop as widgets, records them to a local store you can scroll back through by hour, day or month, and notifies you when a metric spikes or is heading for a threshold.
System monitoring in macOS
- Ships Activity Monitor, which reports CPU, Memory, Energy, Disk and Network in an application window you open when you want to look at it.
- Shows the figures live and does not keep them: nothing tells you what the machine was doing while you were away.
- Says nothing when a metric goes high — there is no alert, and no notion of a threshold to alert on.
- Offers no readout on the desktop or in the menu bar, so watching a number means keeping a window in front of the work you are trying to watch it for.
System monitoring in Emerald Tools
- Puts nine readouts — CPU, memory, swap, disk, storage I/O, network, battery, GPU and thermal state — in the four corners of any display, up to three per corner.
- Keeps the numbers: one minute at a time for a day, one hour at a time for a month, one day at a time for a year, in a store on your own Mac.
- Detects a spike, and fits a line through the recent samples to predict a threshold before it is reached, with a notification for each.
- Runs from the menu bar with no Dock icon, so the readouts are on the desktop and the app is not in your way.
How to show CPU, GPU and memory usage on the Mac desktop
- Open the Monitor pageInstall Emerald Tools from the Mac App Store and click its icon in the menu bar. Choose Open Dashboard... — or press ⌘D while the menu is open — and pick Monitor in the sidebar, under the Desktop Customization heading.
- Choose the display to put widgets onThe Monitor page lists every display currently connected, each with its own name, its resolution and a count of the widgets already active on it. Widgets belong to a display rather than to the Mac, so a laptop next to an external screen can carry a different set on each. Click the one you want to work on.
- Assign widgets to the cornersThe Widget Placement diagram is a small picture of that display with a plus button in each of its four corners. Click a plus to get the list of widget types — CPU, Memory, Swap, Disk, Thermal, Network, Battery, GPU and Storage I/O — and choose one. Each corner holds up to three, stacked downwards from the top corners and upwards from the bottom ones, so a single display can carry twelve. A widget appears on the desktop the moment you add it, and collection starts with the first one you place.
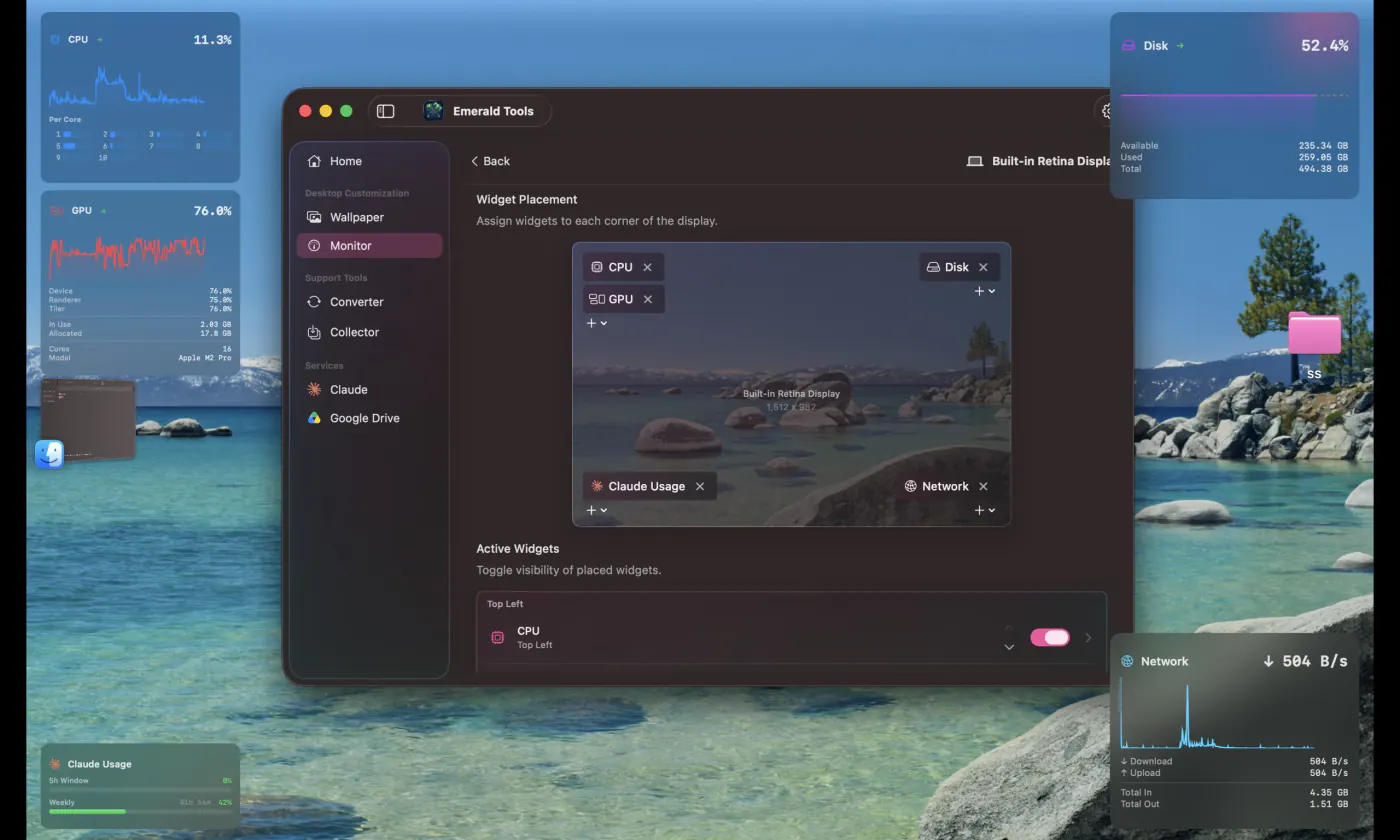
- Click a widget to expand itIn its compact form a widget is a single row: an icon, the current figure and a small graph of the recent past. Click it and it expands in place to show the detail behind that figure — every core for CPU, the renderer and tiler figures and the GPU model for GPU, the active, wired, compressed, inactive and free breakdown for memory, the health and cycle count for battery. Click it again to collapse it. The click is taken by the widget alone — it never brings Emerald Tools to the front.
- Adjust the widgets you have placedBelow the diagram, Active Widgets lists what is on that display, grouped by corner, with a switch to hide one without removing it and arrows to change the order within a corner. The chevron at the end of a row opens that widget on its own page, where its size can be scaled between 50% and 200%, its background made anywhere from opaque to fully transparent, and its graph given a colour of your choosing. CPU and Memory widgets also carry their own alert threshold there, which starts out following the global one.
- Set the sampling interval and the alertsOpen Settings... from the menu bar icon and go to the Monitor tab. Polling Interval decides how often every metric is read — two seconds by default, or five or ten. Spike Detection holds the CPU and Memory thresholds, at 90% and 85% to begin with, and the number of consecutive readings above the threshold that counts as a spike, which is three. Trend Prediction sets how far ahead a threshold is worth predicting, from five minutes to an hour. Both notifications are on to begin with.
- Scroll back through the historyReturn to the Monitor page and the Metrics History panel sits at the top of it, with 1 Hour, 24 Hours, 30 Days and 1 Year to pick from and a menu of eight metrics. Below the chart, Avg, Min, Max and the number of samples describe whatever range is on screen. The last three ranges are read from a store on disk, so they survive a restart; the 1 Hour view is the live buffer and starts filling again when the app launches.
Why a monitor belongs on the desktop rather than in a window
The awkward thing about a system monitor in a window is that you have to be looking at it. Whatever made you want to know the CPU figure — a fan that will not stop, an export that is taking longer than it should, a machine that has gone quiet — happens while your attention is on something else, and by the time you open Activity Monitor the interesting moment has usually passed. What you get is the number now, which is rarely the number you wanted.
Two things follow from that, and they are the two things this feature is built around. The reading has to be somewhere you already look, which on a Mac means the edges of the desktop rather than a window in the middle of it. And it has to be recorded, because the useful question is almost never “what is it now” but “what was it while that was happening”.
Where the app lives: the menu bar, not the Dock
Emerald Tools is a menu bar app. It has no Dock icon and no window of its own until you ask for one, which is what makes it reasonable to leave running for the weeks a history takes to accumulate.
- The menu bar icon is the whole interface. Clicking it opens a small panel with the current state of the wallpaper and screenshot tools, and the two ways into everything else: Open Dashboard… (⌘D) and Settings… (⌘,).
- The Dock icon appears only while a window is open. Opening the dashboard switches the app into an ordinary foreground app, so it gains a Dock icon and an application menu; closing that window puts it back to being a menu bar app alone. If you expected it never to touch the Dock, that is the moment it does.
- Launch at login is off until you turn it on, under Settings > General. Widgets return to their corners when the app starts, so turning it on is what makes them survive a restart without you thinking about it.
- Quitting stops everything. The widgets are windows the app draws; there is no background helper that keeps sampling after you quit.
What each widget shows
Every widget has two forms. Compact is one row — icon, current figure, small graph — at 210 by 64 points. Clicking expands it in place, to 280 points wide and somewhere between 140 and 260 points tall, depending on how much there is to show.
| Widget | Compact | Expanded |
|---|---|---|
| CPU | Overall usage, to one decimal | A bar per core, at whatever core count the machine has |
| Memory | Memory pressure | Active, wired, compressed, inactive and free, with the total |
| Swap | Amount in use | In use and total |
| Disk | Percentage of the startup volume in use | Available, used and total |
| Storage I/O | Read rate | Read and write rates, and the bytes read and written since boot |
| Network | Download rate | Download and upload rates, and total in and out |
| Battery | Charge level | Charging state, health, cycle count and capacity in mAh |
| GPU | Device utilisation | Device, renderer and tiler utilisation, memory in use and allocated, core count and model |
| Thermal | The current state | A four-step scale with a sentence explaining what that state means for performance |
Two of these need a note. Disk is the startup volume only — it answers “am I running out of space”, not “how full is each of my drives”. Battery reports N/A on a Mac that has none, which is the honest answer for a desktop rather than an error.
Sampling, trends and the forecast line
Everything is read on one timer, so the figures in different widgets are of the same instant. At the default two-second interval each widget’s small graph covers the last hour or so; at ten seconds it covers proportionally more, because what the graph holds is a fixed number of samples rather than a fixed span of time.
The trend arrow and the dashed forecast come from a least-squares fit over the recent samples. Three windows are fitted — five minutes, fifteen minutes and an hour — and the one whose fit is best is the one you see, which is what stops a momentary jump from being reported as a trend. Below three samples nothing is claimed at all and the arrow simply does not appear.
The prediction is a straight line, and it is honest about being one. It answers “if the last few minutes continue unchanged, when does this reach the threshold” — useful for a memory figure creeping upward during a long build, useless for anything genuinely spiky. That is why the notification is gated twice: the fit has to be good, and the predicted arrival has to fall inside the horizon you set.
How much history is kept
| Range in the picker | Where it comes from | How far back it goes |
|---|---|---|
| 1 Hour | The live buffer in memory | The most recent 1,800 samples — one hour at the default interval. Empty again after a restart |
| 24 Hours | One average per minute, on disk | 24 hours, then deleted |
| 30 Days | One average per hour, on disk | 30 days, then deleted |
| 1 Year | One average per day, on disk | 365 days, then deleted |
Eight metrics can be charted: CPU, memory, disk, GPU, battery, network, storage I/O and swap. Thermal state is a widget but not a chart — it is one of four named states rather than a number, and averaging it would mean nothing. Network and storage I/O are drawn as two series, in and out, and the summary underneath reports average, minimum, maximum and the sample count for whichever range is showing.
The recording only runs while a widget is placed. Collection begins with the first widget you add and continues until you quit; if no widget is ever placed, nothing is sampled and the Metrics History panel does not appear.
Specifications and limits
Everything below is the behaviour of the current release, not a plan.
- Metrics: CPU, memory, swap, disk, storage I/O, network, battery, GPU, thermal state.
- Widgets per corner: up to three, in four corners, so up to twelve per display.
- Displays: no limit; each display holds its own placements, remembered by display identity across disconnection and sleep.
- Position: sixteen points in from the corner of the usable screen area, which excludes the menu bar and the Dock.
- Layering: above ordinary windows, present on every Space, and visible alongside full-screen apps.
- Clicks: a widget takes a click to expand or collapse, and never brings the app forward.
- Per-widget adjustments: scale from 50% to 200%, background opacity from 0% to 100%, graph colour, and — for CPU and memory — an alert threshold of its own.
- Sampling interval: 2, 5 or 10 seconds; 2 by default.
- Spike detection: CPU at 90% and memory at 85% by default, both adjustable between 50% and 100%, for three consecutive readings by default.
- Prediction horizon: 5 to 60 minutes; 15 by default.
- Notification rate: at most one of each kind every five minutes.
- History retention: minute averages 24 hours, hour averages 30 days, day averages one year.
- Storage: a single local database on your Mac. No account, no sync, no upload.
- Permissions used: none for the metrics; Notifications only for the spike and prediction alerts.
- System requirement: macOS 14.0 (Sonoma) or later.
Widgets stay out of the app’s own screenshots. Emerald Tools excludes its wallpaper, overlay and widget windows from every capture its screenshot tool takes, so a shot of your desktop is a shot of your desktop rather than a photograph of the app’s own layers.
Frequently asked questions
Does macOS show CPU and GPU usage on the desktop already?
Not on the desktop. Activity Monitor covers CPU, Memory, Energy, Disk and Network in an application window, but there is no built-in readout that sits on the desktop or in the menu bar, and no record of what the figures were earlier. Emerald Tools adds the placement, the history and the alerting; Activity Monitor remains the better place to look at what an individual process is doing.
Which metrics can the widgets show?
Nine: CPU with a per-core breakdown, memory pressure with the active, wired, compressed, inactive and free split, swap, disk space on the startup volume, storage read and write rates, network download and upload rates, battery level with health and cycle count, GPU utilisation with its memory and model, and the thermal state macOS reports. A tenth widget type reports claude.ai usage and is covered in its own guide.
Can each display have its own widgets?
Yes. A placement belongs to a specific display, and the app remembers which display by identity rather than by position, so unplugging a monitor and plugging it back in brings its widgets back to the corners you put them in. There is no limit on the number of displays; the limit is three widgets per corner, twelve per display.
Do the widgets get in the way of my windows?
They float above ordinary windows, in the corners of the area that excludes the menu bar and the Dock, sixteen points in from the edge. They do accept a click — that is how expanding one works — but the click never brings Emerald Tools to the front, so the app you were using stays where it was. They stay put across Spaces and remain visible alongside a full-screen app.
How often are the metrics read, and can I make it less frequent?
Every two seconds by default. Settings > Monitor offers five and ten seconds as well, and the change takes effect immediately. The interval also decides how much wall-clock time the live 1 Hour view covers, because that view holds the most recent 1,800 samples — exactly an hour at two seconds, and proportionally more at a longer interval.
How long is the history kept, and where does it go?
Minute averages are kept for 24 hours, hour averages for 30 days and day averages for a year, after which each is deleted automatically. All of it lives in a single local database on your Mac. Nothing is uploaded, there is no account, and the developer runs no server for this feature; deleting the app takes the history with it.
What is the dashed line at the right of the graph?
A forecast. The app fits a least-squares line through the recent samples over three windows — five minutes, fifteen minutes and an hour — keeps whichever fits best, and extends it into the right-hand fifteen percent of the graph: orange when the trend is rising, cyan when it is falling. It is drawn only when the fit is good enough to be worth showing, and the small arrow beside the metric name says the same thing in one glyph.
When does it send a notification?
Two cases. A spike notification when CPU or memory stays above its threshold for the required number of consecutive readings — 90%, 85% and three readings unless you change them. A prediction notification when the fitted trend says a threshold will be reached inside the prediction horizon, which is fifteen minutes by default. Both are on by default, both can be switched off in Settings > Monitor, and neither repeats more than once every five minutes.
Does monitoring need any special permission?
No permission is needed to read the metrics themselves — they come from interfaces macOS makes available to any app. The only permission involved is Notifications, and only if you want the spike and prediction alerts; with it declined the widgets and the history work exactly as before.
What do I need to run Emerald Tools?
A Mac running macOS 14.0 (Sonoma) or later. Emerald Tools is a subscription app with a 14-day free trial, and the App Store listing shows the current terms for your region. System monitoring is one of five tools in the app and needs no account, no network access and no configuration beyond placing a widget.
Get Emerald Tools for macOS
System monitor widgets are one of the five tools in Emerald Tools, alongside multi-display live wallpapers, screenshots that upload to Google Drive, a web media collector, and a WebP to MP4 converter. It lives in the menu bar and stays out of your Dock.